
Acknowledgements Emma Neupert, Sport Department, Winchester University
Pre-amble April 2022: I wrote this article back in 2014, so some of the references and analysis is a little out of date. Hopefully ill get time to re-write it properly at some point with some better data and analysis, but if you have any suggestions feel free to comment.
The article covers:
- Background into XC racing
- Literature review of current scientific research into XC racing
- Analysing power data
You might also be interested in:
5 Key Skills to Step-up your XC Racing
Upsize Your Aerobic Engine – 6 Ways to Gain Fitness with Steady State Training
Marginal Vs Major Gains – 3 Things All Cyclist Need to Do to Improve their Performance
How to Train for an MTB XC Race? Training Plan for an XC Rider
How to Improve your Nutrition and Recovery – Insights from Elite Cycling Coach Scott Bugden
Background to Cross Country Mountain Biking
Cross country (XC) mountain biking is a unique cycling sport. XC is technically with some similar requirements to Enduro & Downhill MTB. However the physiological demands are very different, with aerobic endurance being much more important. Cyclocross & road racing have similar physiological demands but are tactically and technically very different
XCO MTB refers to Cross Country ‘Olympic’ format, as it is currently the only Olympic MTB event.
Summary of off-road cycling disciplines- Table 1
| Event | Duration | Terrain | Format | |
| XCO | <2hrs | Mixture of singletrack and dual track, often with moderately technical features and steep sections | Mass start | |
| XC Marathon | <2-24hrs | As for XCO but generally slightly less technical | Mass start | |
| DH | <5mins | Highly technical downhill terrain, with large jumps. | Individual (DH), | |
| Enduro | <30mins | Similar to downhill but more natural trails and less built features | Individual multi stage | |
| Cyclocross | <1hr | Flat, Grass, mud, hurdles | mass start |
Event Profile for XC racing
XC races typically last <2hrs for elite races, with up to 8 laps per race. Riders are gridded and are started onto an open (dual track) section of course and often reach 20-25km/h. Depending on how much singletrack there is, overtaking can be difficult which affects the tactics of the event.
Course Profile
XC race courses are around 4 miles long, tends to have up to 200m of climbing and descending per lap and takes place on a mixture of terrain, such as open fields, moorland, and woodland. Courses are a mix of man made hardpack tracks, freshly raked or grassland.
Obstacles and technical features
XC races feature similar obstacles to downhill/enduro courses, but they are not as extreme being designed to be rideable by most of the field in all weather. Descents tend to be short no more than 1min, but maybe split up with short climbs or flat sections, so there maybe sections of the race with 4-5mins of mostly technical riding. Often with large fields in each race (over 100 at World Cup Level), its important there is enough track which allows overtaking.
Generally higher level races (UCI and National) will have more demanding sections of trail similar to those you’ll see in Enduro races, but these still only make a relatively small portion of the track length.
- Corners- flat, off-camber, bermed, switchbacks
- Climbing- technical and smooth
- Jumps- doubles, table tops
- Log-jumps, stream crossings
- Rock-gardens, steps
How do Cross Country Riders Compare to Other Cycling Disciplines Physiologically?
Here is an example of physiological characteristics for world class riders, taken from the British Cycling Level 3 coaching handbook. The max minute numbers for road and XC racers are fairly typical according to other literature.
Cross Country Rider Profile -Table 2
| Event | Body Weight (kg) | Peak Power (W) | Max Minute Power (W) | P/W (W/kg) |
| Track Sprint | 91 | 2200 | 470 | 5.16 |
| MTB DH | 82 | 1750 | 400 | 4.87 |
| Road Race | 68 | 1200 | 500 | 7.4 |
| MTB XC | 66 | 1150 | 500 | 7.6 |
| TT | 70 | 900 | 525 | 7.5 |
Road and XC racers are similar, however XC racers are generally slightly lighter than road racers with a higher power to weight ratio. Which makes sense, as energy losses off road, largely come down to rolling resistance, as opposed to air resistance on the road. Rolling resistance is almost directly proportional to weight (of bike and rider).
Andrew Coggan created a more in depth table for road and track riders, which gives suggested performance bands for certain power outputs at certain durations. You can read more about it here. However, these dont take into the many of the specific fitness elements required for XC racing.
Components of fitness
This is one way coaches conceptualise the physical demands of a cycling discipline and to plan appropriate training.
- Aerobic endurance or aerobic capacity- the ability to sustain a continuous effort for a long period of time
- Short term muscular endurance (STME)- the ability to sustain a near to sprint effort, or repeat such efforts multiple times.
- Muscle Power- the ability to produce instantaneous power, torque or speed for a few seconds
- Strength- ability to apply load/force/torque
- Speed – the ability to accelerate cadence or to achieve a maximum cadence
- Flexibility- the range of movement of joints/limbs
What phsyiology makes a good XC racer?
A scientific perspective…
Here is a summary of the investigation methods used in the articles I reviewed:
- three of the six articles correlated lab test data with performance in XCO races (FM Impellizeri et al. 2005 , FM Impellizeri et al. 2005, A Inoue et al.)
- one of these correlated anaerobic lab tests with XCO race time (A Inoue et al.)
- four out of six of the articles used international level subjects, with the other two using national/regional level subjects
What does the research tell us?
Maximal aerobic power (Wmax) normalised to weight does correlate with cycling performance, with international standard riders achieving upwards of 350 W or 5.5 W/kg in incremental maximal aerobic tests. Which is a similar fitness to a domestic level Elite road racer.
The one study that correlated anaerobic Wingate tests (30s test) with XCO race time found that there was a good correlation between anaerobic power (normalised to weight) and XCO race time. The same study also used a Wingate test repeated 5 times with 30s rest periods and the results from this were correlated more strongly with XCO race times. Coggan’s normalized power function selects intervals of 30s as being significant to represent the physiological demand of a ride. (see below for an explanation of normalized power). The studies confirm that international level road and XCO racers are similar in terms of Wmax and VO2 max variables.
The studies did not collect much useful data to help analyse race performance. An analysis of riders’ times over climbs, flat sections and descents would be fairly straightforward, and would give more opportunity to find correlations to lab test data.
The lab tests suggest that standard lab test procedures (i.e Wmax test) is unsuitable for benchmarking XC race performance and that a test using repeated intervals should be more widely used. Moreover lab tests should be specific to the event that a rider is training for.
Is a power meter a useful tool?
Power gives us an estimation of the kinetic energy output of a rider
Power provides a measure of intensity that is more independent from the rider or external surroundings, than other variables such as speed, heart rate, RPE (rating of perceived exertion) or VAM (mean ascent velocity).
Power helps to isolate changes in heart rate, and RPE in order to interpret how the rider is responding physiologically to the training.
Power is practically useful to training in two ways:
- It gives us insight into how we can train more specifically for an event- through analysis of race data.
- It helps us to measure progression in training- through monitoring training data.
Do you need a powermeter?
Using a powermeter is icing on the cake when it comes to training. While it can be a really useful tool for researchers and coaches to help understand physical demands. For non-elite riders they are unlikely to serve much useful purpose unless you’ve maximised gains in all the key areas:
- You are following a suitably challenging training plan, that develops STME and aerobic capacity and allows for effective recovery.
- You are maximising competitive gains through tactics and efficient technique
- You have a good diet that optimises body composition and recovery.
- You have optimised bike setup for you and the terrain you are racing on.
For the average amateur rider with 10 hrs a week to train, this is a lot to achieve!
Why is Power Useful for XC Racing?
In cross country racing the rider will optimise their pace in order to complete the course in the shortest time. Tactics also play a major part.
So how will riders optimise their energy expenditure on parts of the course?
- On technical sections a rider will optimise their speed in order to limit energy loss through braking and body movement
- On uphill and flat sections a rider will increase their power output in order to maximise their average speed. Power helps us to see the exact kinetic energy output of these efforts
Pedalling effort:
Generally, XC riders arent pedalling continuosly for long periods like in a road race.
- Short 1s repeated pedal strokes, e.g pedalling between two corners in singletrack
- Short 5-20s efforts, e.g short explosive climbs, or longer sections in singletrack
- Extended efforts>20s
- Long efforts >3mins
But Power doesn’t show the whole picture
Power metering is popular for road and track cycling, because power output correlates closely with a rider’s velocity. However, in BMX and downhill racing we can see that the rider’s speed depends on power output through ‘pumping’ with the arms and legs as well as pedalling. Similarly, in cross country there is energy expenditure that cannot be measured with most power meters due to non-pedalling movements.
Technical ability is also highly important in race performance, and this ability cannot be seperated from physiology. If a rider can negotiate a technical section relatively fast in a practice scenario it doesnt necessarily mean they will be as fast in a race scenario.
Non-pedalling effort:
- Short ~1s movements for individual obstacles, corners, drops, log jumps etc. These movements could have little affect on average speed but may be necessary in order to complete the course.
- Involuntary energy expenditure used to absorb impacts and vibration while riding on rough ground.
- Pumping movements which can be used to increase speed through turns, jumps and other rollable features
Analysing power data
There are various metrics that can provide quick, helpful insight into power data.
Normalized Power (NP) Explained:
The selection of a 30s interval used in the study above is particularly interesting as Coggan’s normalized power averaging method also uses a 30s time period. NP is calculated as follows
A 30s moving average is taken for 1s measuring intervals this would the average of 30 measurements, so at 15s into the ride:
(W1 + W2 + W3…+W30)/30= AW15 (average power at 15s)
This is carried out for every 1s intervals and each average raised to the 4th power, these values are then averaged over the ride duration
(AW15^4+AW16^4+AW17^4….AWn)/n
Then take the fourth root of this.
The power vs lactate curve is roughly a fourth power curve, so taking the fourth root applies an approximate weighting to more intense efforts. NP is desgined to represent the long term effect of short muscular efforts, for endurance cycling. Averaging over a shorter interval of 30s is appropriate as it best represents these short muscular efforts.
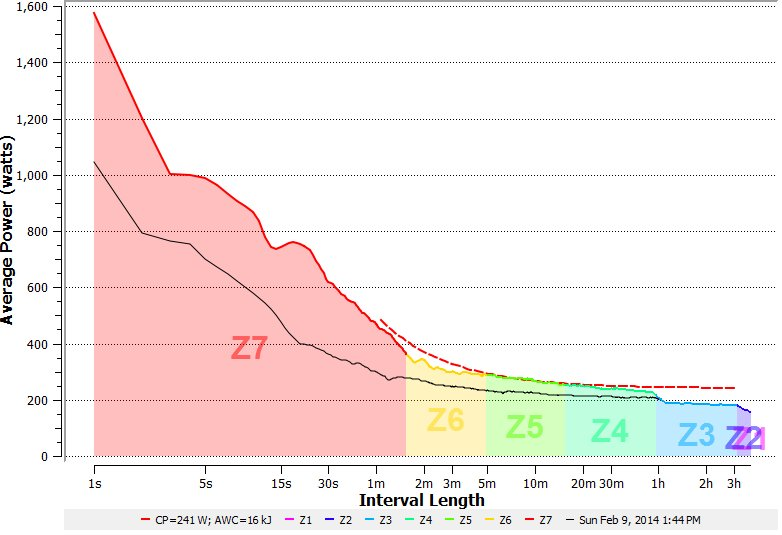
Critical Power profiles
Critical power profiles assist in highlighting major discrepancies in a rider’s power ability over a range of interval durations. I would start by assessing FTP, 5min and 1s peak power and compare these figures with data available from scientific research for XC riders. You can use Andrew Coggan’s Rider Abilities Profile, but bear in mind that the data used for his profile includes track sprint riders.
For this 58kg rider below we can see that they are able to produce >17W/kg 1s peak power, ~4.8W/kg FTP and ~5.2W/kg 5min power. Elite XC riders can produce >18W/kg 1s peak power, >5.5W/kg FTP and >7.5W/kg 5min. This suggests this rider’s main area of weakness is in Vo2max level efforts, but its always important to consider the broader picture, and the end result doesnt show the process of how to get there.
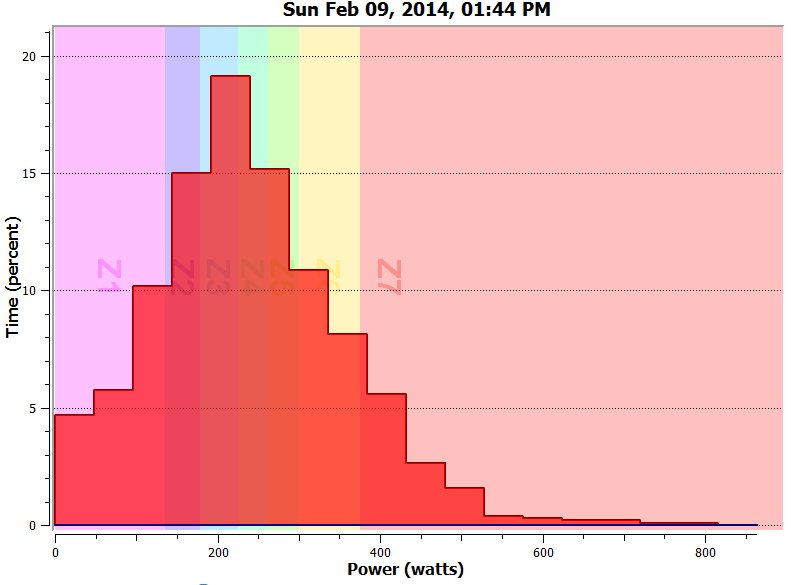
Histogram analysis
Histogram analysis is useful for finding out how the workload is distributed across certain power ouputs. This does not give any indication of the length of interval that contributes to each power-bin-range.
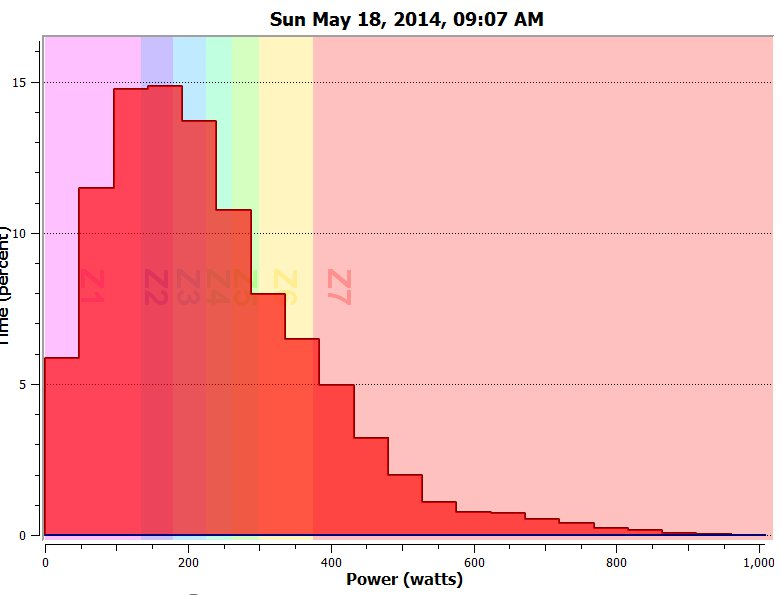
The histogram in figure 2 has a typical bell curve shape (normally distributed), whereas the histogram from a road race in Figure 3 is heavily weighted to the lower power outputs. The 50th Percentile range is roughly Z2-Z5. This means that aerobic endurance will always be a key factor in XC race performance. Whether, thats due to the fact that riders spend a lot of time recovering at a Z2-3 intensity or that relatively large time gains are made at a Z4-5 power output.
This is a flat cross country race in February, 45 mins is below Z3 and 53.5 mins is above Z3.
This is a flat road race, 61.5 mins below Z3 and 33 mins above Z3
Race Analysis
In the next step I analysed some of my race data to assess the demands of racing. I carried out an analysis of the intervals that made up a cross country race.
Note: this analysis is based on a relatively flat and not very technical cross country race and for one rider. The data for a hilly technical race or for different riders could be different.
Interval Selection
I selected intervals on the basis that each interval was a pedalling effort split up by a zero cadence and zero power interval. I also worked out where these intervals occurred in respect to technical course features. Figure 4 shows alternate intervals, marked by the blue and grey line colours. Generally non pedalling sections occurred at corners, but the other non-pedalling sections were due to technical features
NOTE II: The reliability of this analysis is limited by the accuracy of the power measuring device. I was using a Stages (non-driveside) crank arm. The device only gives a power reading when there is a cadence and a force registered in the non-driveside crank.
I am using Golden Cheetah V3 and WKO + v3 for this. The programs use slightly different computation for metrics such as normalized power (NP) and Training Stress Scores (TSS).
Course Profile:
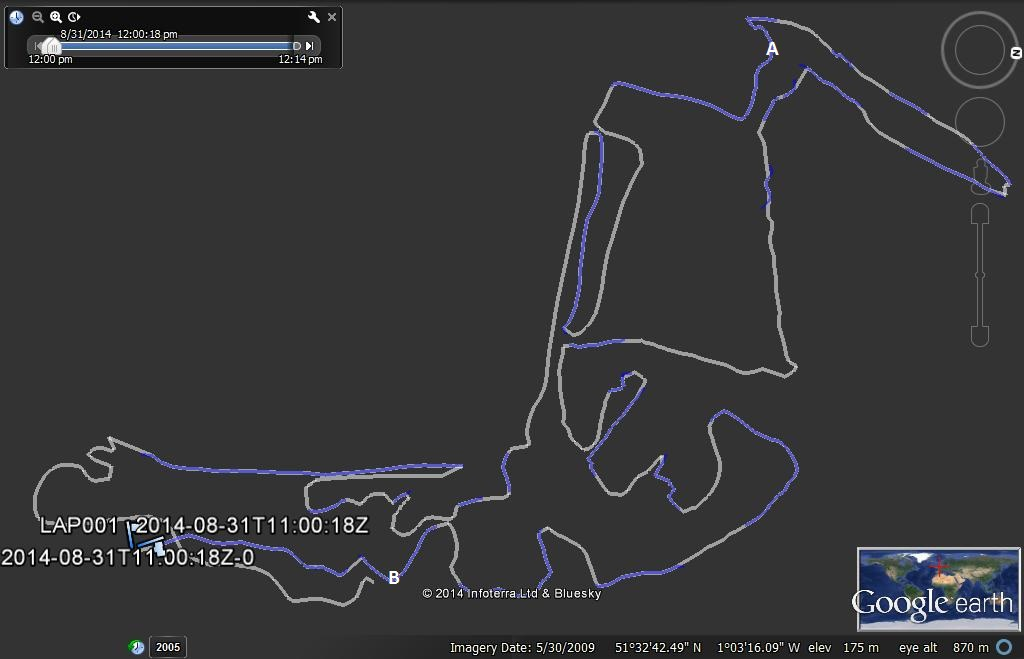
Figure 4 Note points A and B show where lap splits were taken[/caption]
Metrics for each 4.4km lap- Table 3
| Interval Name | Duration | Average Power (watts) | xPower (watts) | Average Heart Rate (bpm) | Average Speed (km/h) | ||||
| Lap 1 | 13.25 | 308 | 314 | 173 | 19.3 | ||||
| Lap 2 | 13.42 | 276 | 285 | 169 | 18.7 | ||||
| Lap 3 | 13:46 | 281 | 294 | 170 | 19.2 | ||||
| Lap 4 | 13:49 | 286 | 298 | 165 | 18.8 | ||||
| Lap 5 | 13:54 | 275 | 293 | 167 | 18.8 |
You can see there is a large drop off in power after the first lap of about 10%.
Analysis of Lap Splits – Table 4
| time | Average Power | HR (BPM) | Speed (Km/h) | |
| Split 1 | 07:09 | 287 | 170 | 17.6 |
| Split 2 | 06:36 | 323 | 177 | 20.9 |
| Split 3 | 06:54 | 251 | 167 | 17.7 |
| Split 4 | 06:46 | 305 | 171 | 19.8 |
| Split 5 | 07:58 | 268 | 169 | 17.9 |
| Split 6 | 05:36 | 300 | 173 | 21 |
| Split 7 | 07:13 | 257 | 162 | 16.7 |
| Split 8 | 06:11 | 314 | 169 | 21.5 |
| Split 9 | 07:19 | 245 | 164 | 16.6 |
| Split 10 | 04:37 | 351 | 172 | 23.4 |
Note: For every lap there are two lap splits
The second half of each lap (split 2,4,6, 8 & 10), has a higher average HR and Power output. This is due to the technical nature of the first half of the course which made it more difficult to pedal. The ratio of average power to heart rate for splits 2,4,6,8 and 10 was 1.63 whereas for splits 1,3,5,7 and 9 it was 1.79. This could be due to non-pedalling movements, or it could be recovery from high lactate levels produced during the second half of the course, or it could just be
Interval Analysis
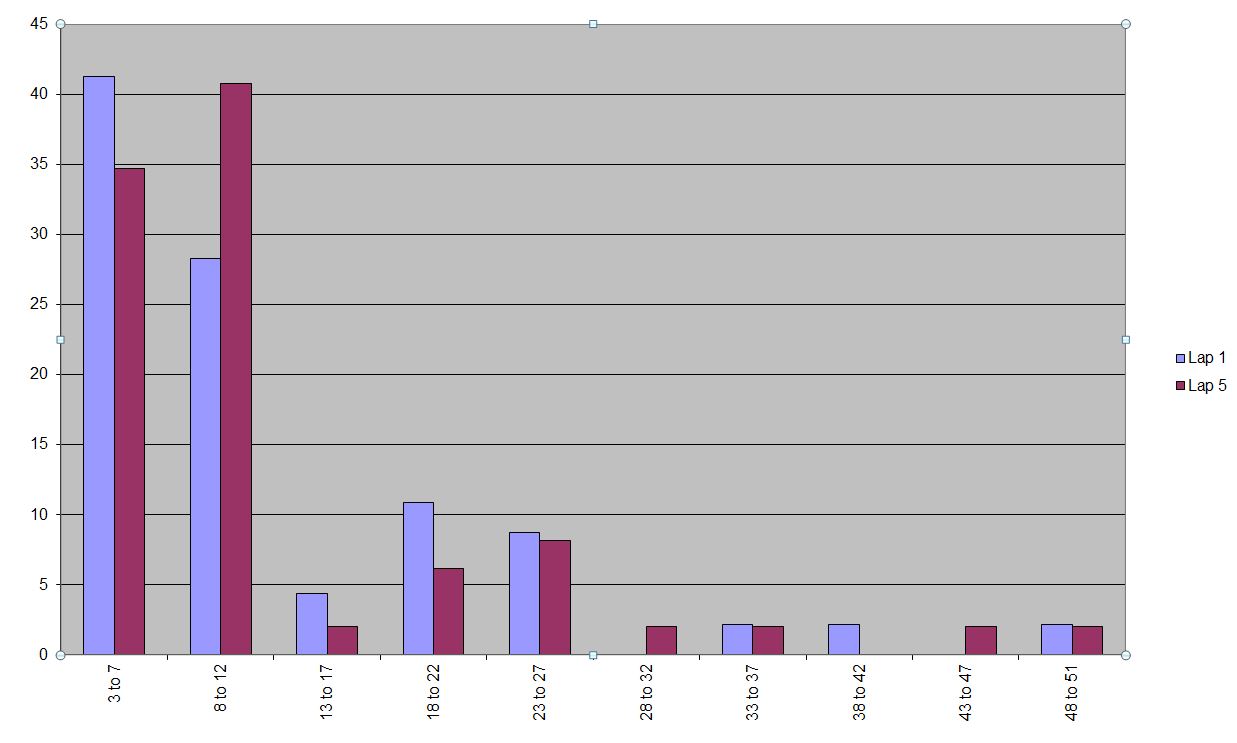
I analysed the intervals for laps 1 and 5 and there were between 46 and 50 intervals per lap respectively.
The table below shows that about 1/4 of a lap was zero cadence, and that the average power for the remaining pedalling time was ~360W.
Table 5
| Lap | Zero Power Time % | Average interval duration (s) | Average Power for individual intervals (W) | |
| Lap 1 | 25 | 13 | 403 | |
| Lap 5 | 22 | 13 | 357 |
The intervals for lap 1 are plotted on Figure 5 to help understand the technical features involved in the zero cadence elements.
Figure 5 shows that around 80% of the work periods are made up of intervals between 3 and 12 s.
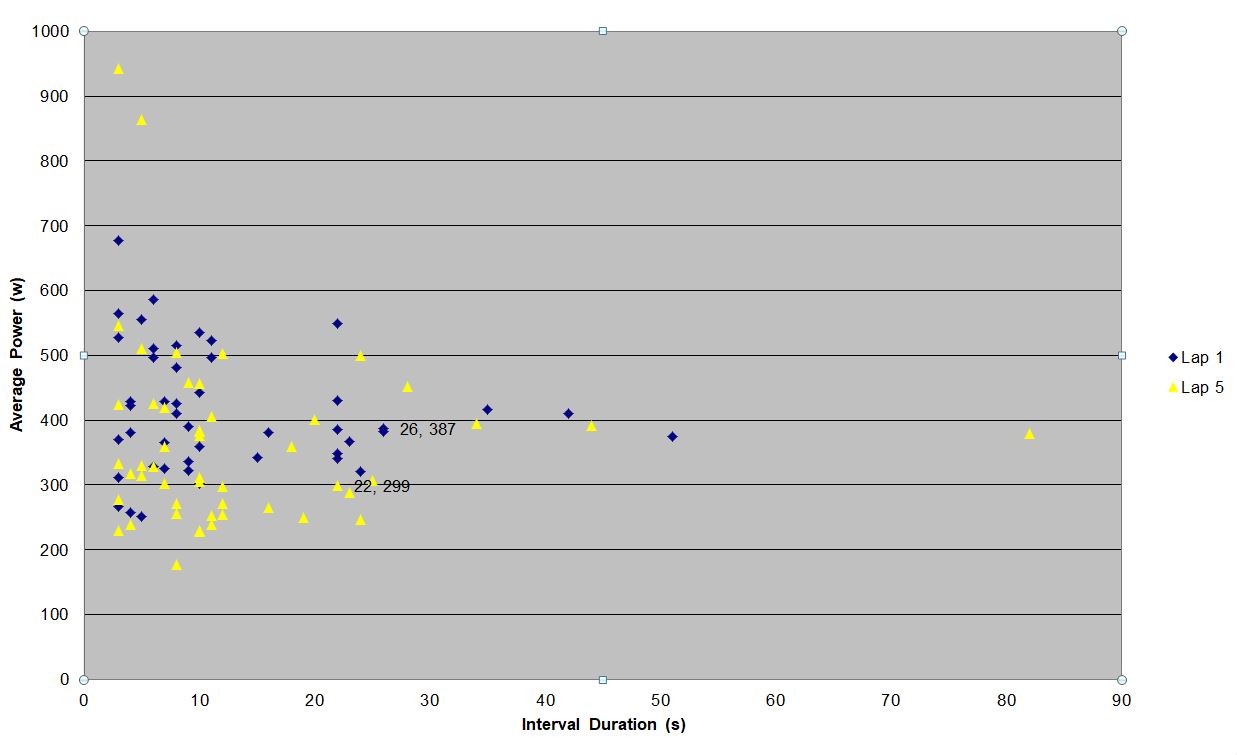
Figure 6 shows that for longer intervals the average power becomes more consistent.
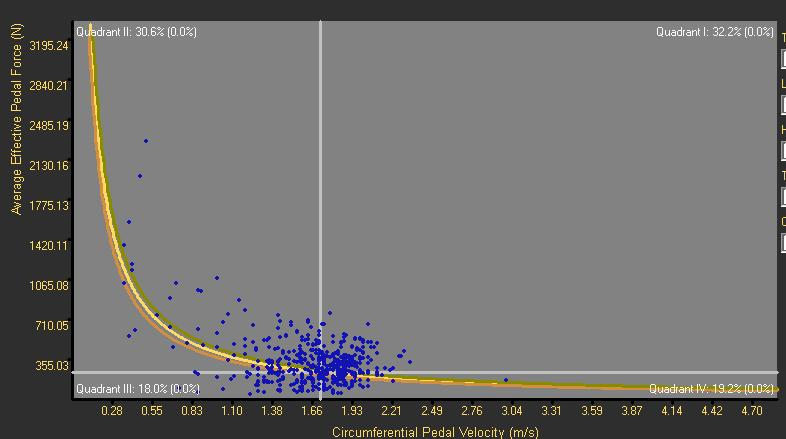
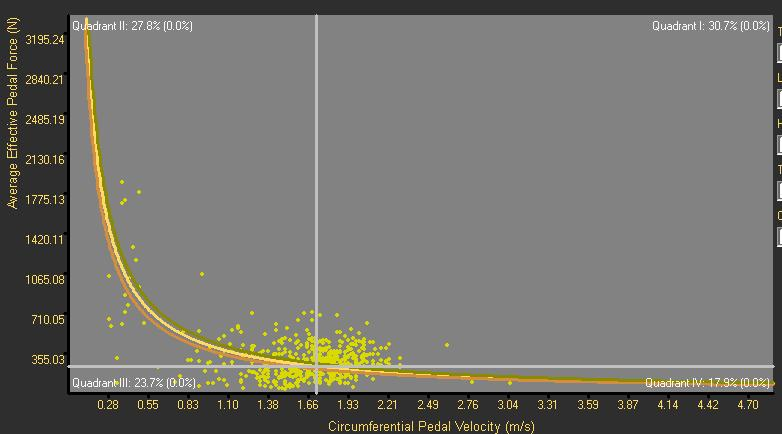
Figure 7 and 8 show that for Lap 1 and Lap 5 a large proportion of the work was carried out in Quadrants I and II. The drop in power between Lap 1 and Lap 5 can account for a loss of 2.8% in Q II, 1.5% in QI and 1.3% in Q IV. This suggest that high force, low cadence power is the key muscular endurance demand for this race. Bearing in mind the technical demands, this is likely to be due to short accelerations and the limitation of grip when accelerating. Accelerating from a harder gear at a lower cadence, maintains grip as well as allowing the rider to lift the weight out of the saddle to flow over technical features.
Conclusion
This article highlights how XCO racing phsyiology is characterised by the ability to deliver power of a large number of short intervals, with relatively short non-pedalling recoveries in between. The rider’s performance is largely defined by aerobic endurance ability as most of the power output takes place in a Z2-4 intensity range. Most of this effort takes place at a high force/torque level, meaning that riders are often accelerating under a relatively high load. This analysis is for one relatively flat XC race, and one rider. The demands will be different for hillier more technical courses and different riders.
Remember, XC racing is a highly technical discipline. While its not easy to compare the relative importance of technical vs physical ability, technical ability accounts for a large part of performance.
Get in touch!
My blog is all about gaining insight on performance and learning, in a forward-thinking way. So if you have a different viewpoint, or want to discuss the topic, find me on Instagram and Facebook @rideaboutuk
References
F M Impellizzeri, S M Marcora, E Rampinini, P Mognoni, A Sassi: Correlations between physiological variables and performance in high level cross country off road cyclists. Br J Sports Med 2005;39:747-751.
Ramon Baron: Aerobic and anaerobic power characteristics of off-road cyclists. Institute of Sports Science, Department of prevention and rehabilitation and sports medicine, University of Vienna, austria. Medicine and science in sports and exercise, 2001.
France M. Impellizzeri and Samuele M. Marcora: The physiology of mountain biking. Sports Med 2007: 37 (1): 59-71
Vp Costa VP FR De-oliveira. Physiological variables to predict performance in cross-country mountain bike races. Jornal of Exercise Physiology. Volume 11 Number 6
Allan Inoue, A S Sa´Filho, F C M. Mello, T M. Santos. relationship between anaerobic cycling tests and mountain bike cross-country performance. Journal of strength and conditioning research 26(6)/1589-1593.
H lee, D T. martin, J M anson, D grundy and A G hahn. Physiological characteristics of successful mountain bikers and professional road cyclists. Journal of Sports Science, 2002, 20, 1001-1008. elite international
B StapelfeldtA SchwirtzY O SchumacherM Hillebrecht Workload demands in mountain bike racing. International Journal of Sports Medicine (Impact Factor: 2.27). 05/2004; 25(4):294-300.
Impellizzeri FM1, Rampinini E, Sassi A, Mognoni P, Marcora S.Physiological correlates to off-road cycling performance. J Sports Sci. 2005 Jan;23(1):41-7.